
Five Numbers Worth Logging Every Week on a Mining Desk
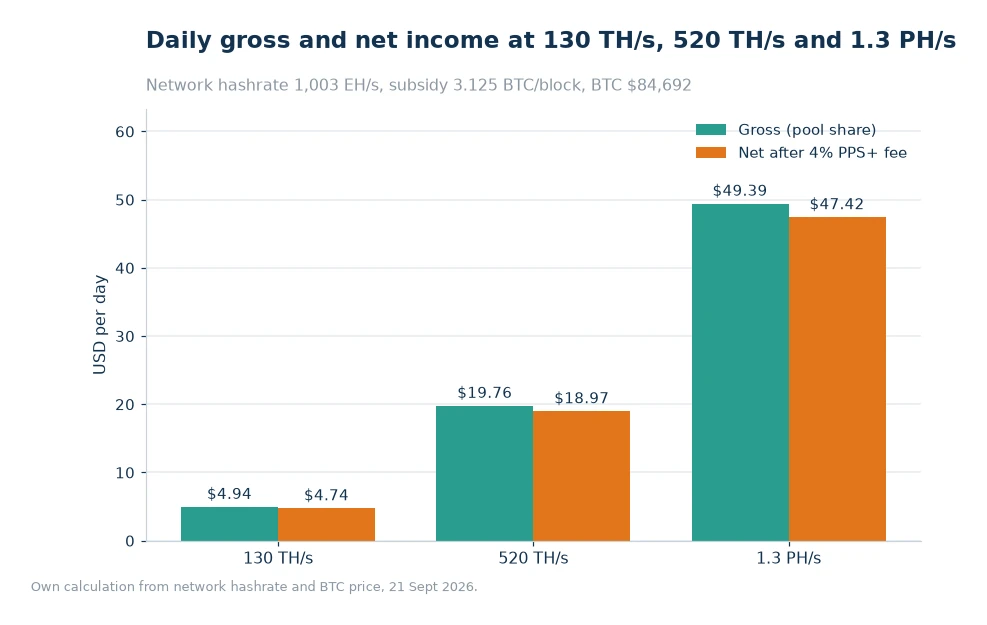
Dashboards show everything and remember nothing. A weekly log of five figures will tell you more about a mining site than a wall of live charts, because it puts the same numbers side by side at the same interval. At 520 TH/s the credit is 0.00023330 BTC a day, $19.76 gross and $18.97 net, and seven days of that is the first line of the page.
Key takeaways
- 130 TH/s returns 0.00005832 BTC a day, $4.94 gross and $4.74 net after the listed 4%.
- 520 TH/s returns $19.76 gross and $18.97 net; 1.3 PH/s returns $49.39 and $47.42.
- Weekly, the same hashrates net $33.18, $132.79 and $331.94 before power.
- Log on the same weekday each week, or the comparison is meaningless.
Why a week is the right unit
A day is too short. Share variance, a difficulty tick and a warm afternoon can move a daily total by several percent without anything being wrong. A month is too long: by the time a falling trend is obvious, four weeks of margin are gone. A week sits between the two, long enough to average out the noise and short enough to catch a drift while it is still cheap to fix.
The other reason is behavioural. A weekly habit is easy to keep and hard to fake. Daily logging collapses after the first busy week, and monthly logging turns into a reconstruction from exports. Pick a weekday, pick a time, and write the five figures before opening anything else. Ten minutes on a Tuesday is worth more than an hour of sorting through statements at the end of the quarter.
The lines and their arithmetic
The table is transposed on purpose: the five lines run down the side and the three site sizes run across the top. That way one page covers a small desk and a container without changing the form. Power is costed at $0.05 per kWh and 28 J/TH, both assumptions to replace with your own figures.
| Weekly line | 130 TH/s | 520 TH/s | 1.3 PH/s |
|---|---|---|---|
| Credit over 7 days | $33.18 | $132.79 | $331.94 |
| Power over 7 days | $30.58 | $122.30 | $305.75 |
| Margin over 7 days | $2.60 | $10.49 | $26.19 |
| Margin per TH/s | $0.020 | $0.020 | $0.020 |
The last line is the one to watch over months. If margin per terahash is flat while the site grows, growth is working. If it falls, the new machines are worse than the old ones or the power is getting more expensive, and the total can rise while the business gets weaker. That is the failure a dashboard will happily hide, because every individual chart still looks busy.
What to do when a line breaks its band
Give each line a band and a response. Credit within 5% of expectation needs nothing. Between 5% and 10% low, check the effective hashrate and the temperature before touching hardware. More than 10% low for two weeks, open a ticket or call the electrician depending on which line moved.
Power is the mirror image. A power line that is 5% above its usual figure with flat credit is the more dangerous of the two, because it means the same output is costing more. That is usually a cooling problem, a failing PSU or a tariff change, and it erodes margin faster than a hashrate dip of the same size.
The number that is not on the dashboard
Tariff belongs on the page even though the pool cannot see it. Write the rate you actually pay, including standing charges divided across the month, rather than the headline unit rate. A site paying $0.048 plus a fixed fee can be more expensive than one paying $0.052 with nothing attached, and the log is where that becomes visible.
Do the same for rent and any hosting fee. The five lines then become seven or eight, which is still one page. The point is not austerity; it is that a number you never write down is a number you never check.
There is a useful test for any line you are tempted to add: can it change a decision within a month? A metric that only gets read at the end of the year belongs in an annual review, not on the weekly page. Keeping the page short is what keeps it honest, and a short page gets filled in even during a bad week when the numbers are the ones you least want to see.
Keep the log where the account lives
A spreadsheet is fine. A note in the same place as the account recovery details is better, because the figures and the access belong together. Export the settlement history once a week and reconcile the credit line against it, so the log is a check on the pool as well as on the machines.
Under PPS+ the credit lands hourly, which makes a weekly export tidy: 168 entries, one total. Under PPLNS the entries are lumpier and the weekly total depends on when blocks confirmed, so note the plan on the page. Comparing a PPLNS week against a PPS+ expectation is a common source of false alarms.
A quarter of entries beats a clever chart
Thirteen weeks of five lines is enough to see seasonality, difficulty drift and the effect of a hardware change. It is also small enough to read in a minute. Most mining sites do not need better analytics; they need a record that outlives the person who set the site up, and a page that anyone can open without training.
The ViaBTC Mining Guide covers the account side of the reconciliation, and the ViaBTC Mining Calculator produces the expectation for the credit line at your hashrate. Everything else on the page comes from a meter and a bill.
Worked example
Take 130 TH/s and build the four lines from scratch, then check that they scale.
Daily coins: 130 ÷ 1,003,000,000 = 0.0000001296 of the network, times 450 BTC = 0.00005832 BTC. Gross: 0.00005832 × 84,692 = $4.94. Less the 4% PPS+ charge: 4.94 × 0.96 = $4.74. Seven days: 4.74 × 7 = $33.18.
Power: 130 × 28 J = 3,640 W, or 3.64 kW. Over a week: 3.64 × 24 × 7 = 611.5 kWh. At $0.05 that is $30.58. Margin: 33.18 − 30.58 = $2.60, or $0.020 per TH/s per week.
Scale to 520 TH/s, which is four times 130: credit 4 × 33.18 = $132.72, which rounds to the $132.79 in the table; power 4 × 30.58 = $122.32; margin 4 × 2.60 = $10.40. Scale to 1.3 PH/s, ten times 130: credit $331.80, power $305.80, margin $26.00. The per-terahash line stays at two cents, which is the signal that nothing structural changed.
Frequently asked questions
Why log weekly rather than daily?
A week averages out share variance and difficulty ticks while still catching a drift within days. Daily entries are too noisy to act on and too easy to abandon.
What margin per terahash should I expect?
It depends entirely on the tariff and the machine's efficiency. At 28 J/TH and $0.05 per kWh, the three sizes above all land near $0.020 per TH/s per week after the listed 4%.
Should the log include rent and hosting fees?
Yes. The pool credit is only half of a margin. Rent, hosting and standing charges belong on the same page, or the weekly totals will flatter the site.
Same day, same page, every week
Put the reminder in the calendar with the five line names in the description. When it fires, export the week, fill the lines and stop. The value comes from repetition, not from the sophistication of the form.
After a quarter, read the whole page at once. The trend will be obvious, and so will the week when something changed. That is the moment to consult the pool state page and work out whether the change was yours or the network's.
Sources: ViaBTC guide, calculator and pool-state pages[1]. Read 21 Sept 2026: network 1,003 EH/s at 132.76 T, subsidy 3.125 BTC, 144 blocks a day, BTC $84,692. Published 24 Oct 2026. Power assumes 28 J/TH at $0.05 per kWh.